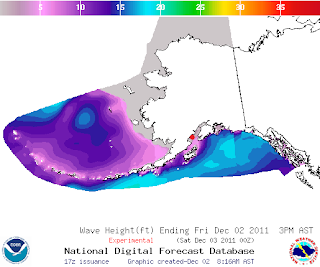
According to the Koppen/Gieger Climate Chart, Augustine Island is classified as a Dfc. D meaning snow, f meaning fully humid, and c meaning cool summer. This is characteristic of a majority of the 50-70 degree latitude locations. In analyzing the micro and meso scales of climate controls for Augustine Island, I thought it would be interesting to look at the trend in wave heights around the area, as it could be an indicator of weather at my location. Below is a graphical sequence of wave heights for Kachemak Bay and the Gulf of Alaska, with the first picture showing a broader view, followed by a zoomed sequence to show greater detail. Augustine Island is indicated by the small red dot.
It is clear that during times of increasing wave height in the Gulf of Alaska, the wave heights surrounding Augustine Island are not affected as it is geographically protected by the Kenai Peninsula, Kodiak Island, as well as the Aleutian Range. It is because of the geographic location that the island experiences an orographic effect and is essentially protected by this, giving it and the surrounding area a relatively stable seasonal variation relative to most parts of Alaska. Because of the protection provided by the topography, in addition to the maritime climate, the summers stay relatively cool, and the winters can be extremely cold but much of the weather is shielded by the Aleutian Range. This allows the Boreal forest and Temperate rainforests to survive along the coasts in this area, wheras on the western coast of Alaska that is not protected by such topography is mainly tundra and exposed to the feirce weather coming from the Northern Pacific. Aside from the geographic location, the weather around Augustine Island can be affected by other elements as well. The most obvious being that the island is a volcanoe. By looking at the current data from weather underground, and comparing it to the data at the time of its last eruption in 2006, it is possible to see how the volcano manipulates the surrounding atmosphere. Below are the contrasting graphs, January of 2011 on the left and January 2006 on the right, as well as a thermal satellite image of an actual eruption from the volcano.
 |
| Photo courtesy of Wikipedia-Augustin Eruptions |
The air pressure of the island is significantly different during a volcanic eruption as can be seen from the Barometric Charts.


No comments:
Post a Comment